Navigating the Change Curve - Basics

The more I coach teams and organizations, the more I see people struggle with change. I sometimes discover “change agents” (i.e., people helping to introduce change) sometimes struggle. Allow me to share a model I find useful in navigating change.
This model will be described over a series of articles that cover the following:
- Basic Concepts of the Change Curve
- Favorable Conditions for Change
- Change as a Commitment Versus an Experiment
- Big Bang Change
- Death By A Thousand Changes
Let’s cover the basics of the change curve next.
Imagine a group of people working together on shared goals. You might call them a team. Once they have been together for a while, they reach a ‘steady state” in their performance even if the team encounters ups and downs. It will tend to look like the figure below.

Perhaps the team wants to do better. Perhaps a leader would like to help the team increase their performance. Regardless, someone believes the team can improve. An individual inside or outside the team introduces a change with the expectation that it will increase the team’s success. One of these scenarios might initiate this change:
- New process
- New team member (with specific expertise)
- New leader
- New tools
Unplanned changes represent other possibilities. Some of those unplanned changes may be:
- New conflict between people
- An urgent request
- An urgent change in direction of the teams goals
- Tool failure
- Process failure
- Team member unexpectedly unavailable
- Leader unavailable
- Supporting organization unavailable (the organization itself undergoing change)
“Things will get better” becomes the mantra of the expected or unexpected change. That hope looks like this:

What can actually happen (given the right conditions), shows up as the following diagram. Notice that the team still encounters ups and downs, but there is an overall downward trend at first as they wrestle with change. This is natural. Then, under the “right conditions,” the team finds a way to adapt to the change. They begin to come out of the struggles and can be better than before.

If we smooth out the curve to see the overall change trend, it resembles the following image.

The stages progress as follows:
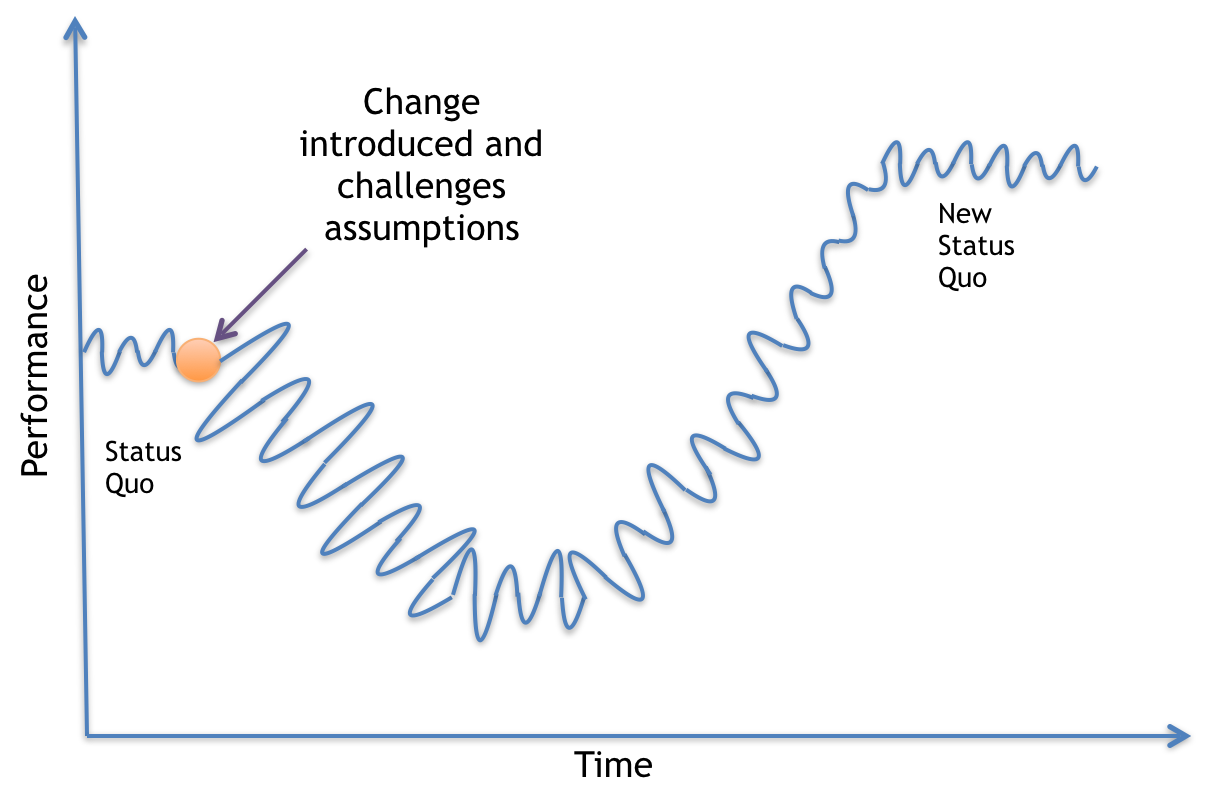
- Status Quo – The old way of working by the team
- Change Introduced – This could be a selected change by the team or a change induced from outside the team. The change ends up challenging some assumptions about the team, the goals, the work, the environment, or a combination of these things.
- Resistance – At first, there is resistance. It could be from one team member. Maybe many team members initially resist. The resistance may even come from the person who introduced the change because they discover their assumptions are challenged about the work and how it can improve. A common phrase in this case: “That’s not what I expected.” If you want to read more about this resistance, I recommend Dale Emery’s article Resistance as a Resource.
- Unlearning – At this point, the team’s performance starts to go down significantly as they question many things about the work and their goals. Their world no longer seems the same.
- Period of Disruption – At this stage, the team just fails to perform the way they use to. Goals slip. Work stalls. The team struggles.
- Transforming idea – A new idea, discovered inside or outside the team, becomes a new way to think about the goals and the work. The team see’s possibilities for improving.
- Integrate New Learning – Now the team rapidly discovers new ways to work and reach the goal, using the change to their advantage. Performance increases – sometimes steadily and sometimes in leaps.
- New Status Quo – The team settles into a new way of working. They know how to achieve their shared goals
Because of the shape of the curve, some refer to this as the J-curve for change. It’s also known as the Satir Change Model and the Kubler-Ross Model. If you are interested in the variations, check out the following:
The Satir Change Model – Some agile coaches were introduced to the Satir Change model through the writing of Jerry Weinberg and others.
- https://stevenmsmith.com/ar-satir-change-model/
- http://dhemery.com/articles/managing_yourself_through_change/
- https://www.jrothman.com/articles/2001/10/manager-heal-thyself-improving-software-processes-means-changing-management-processes/
Kubler-Ross Model – This model focuses more on processing grieg around change.
Change Curve – some lean more toward the Satir version and some more toward the Kubler-Ross version. The distinction shows when they talk more about the emotional reactions to the change.
- https://www.insights.com/us/resources/coaching-people-through-the-change-curve/
- https://www.mindtools.com/pages/article/newPPM_96.htm
- https://www.generatortalent.com/use-change-curve-change-management/
In the next post, I’ll share the favorable conditions to navigate this curve.